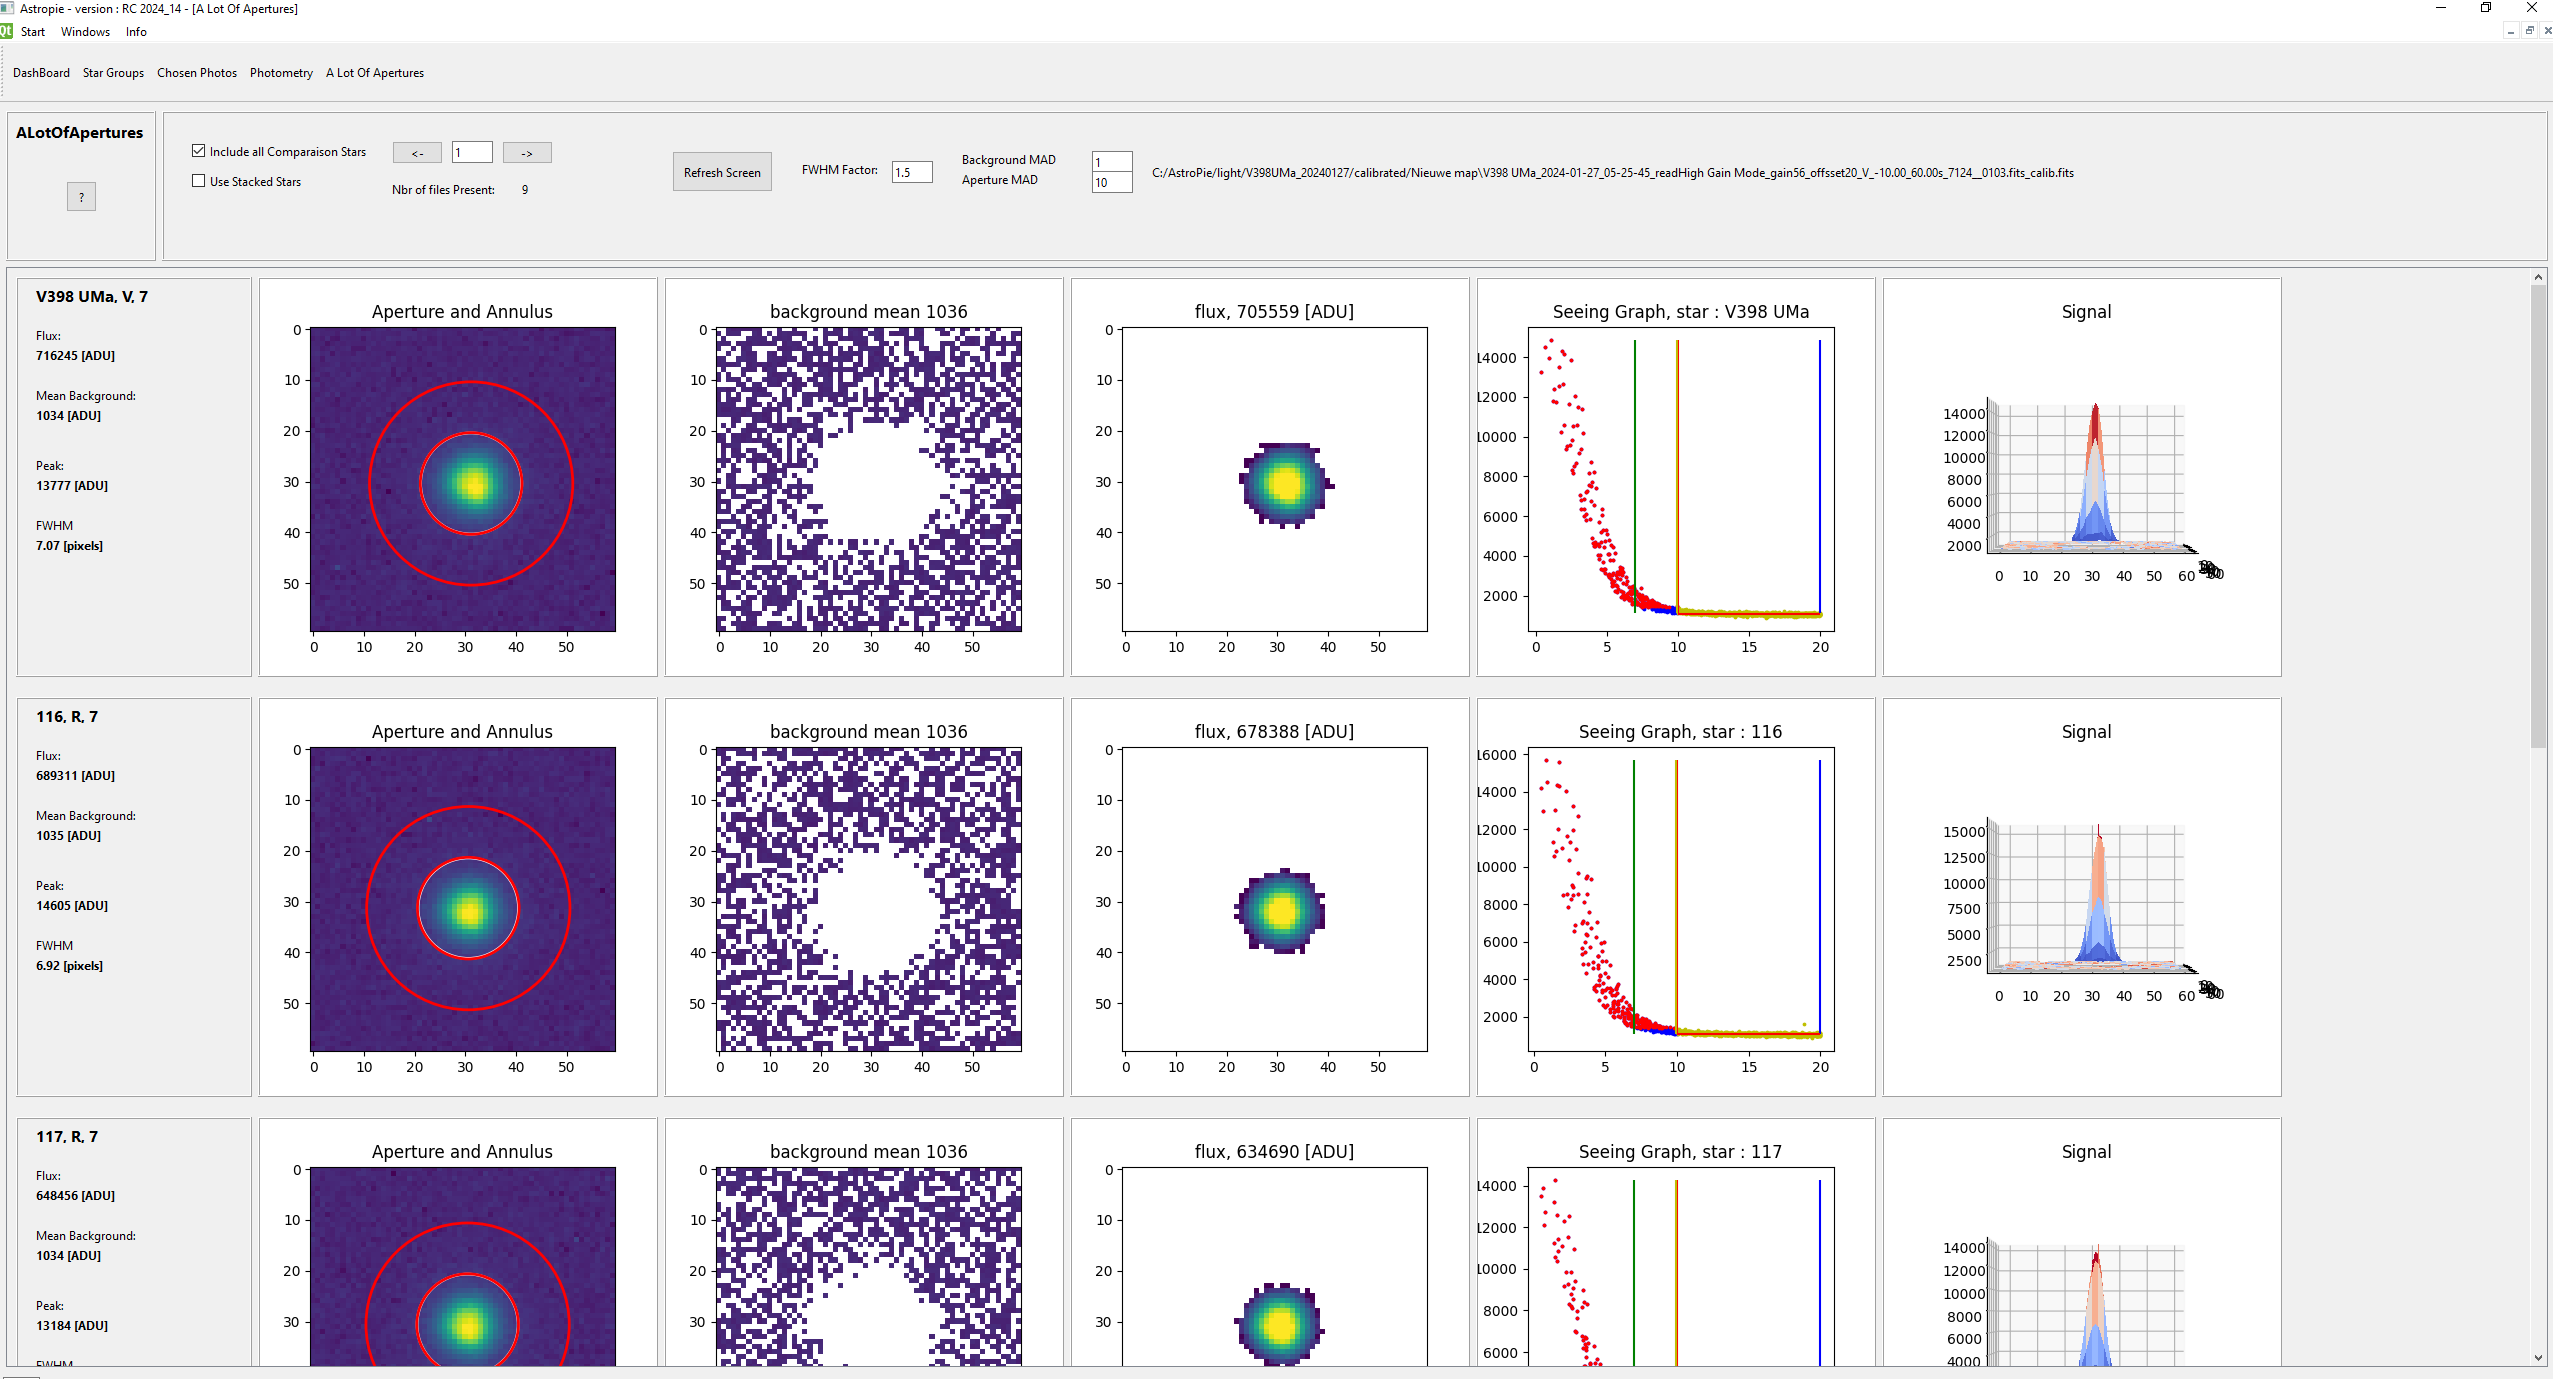
A Lot Of Apertures
The purpose of this screen is to show some detail of each (selected) star on a photo : the star itself, the aperture and annulus over the star, the used background pixels, the seeing graph and the signal.
One has to run first a photometry on a folder before this screen can be used. After that, the stars of the first photo of the folder are shown.
Of course, one can scroll through all photo's in the folder.
The Header
- Include all Comparaison Stars :
if checked : the comparaison stars (R or C) will be shown, and also the stars that have "ok = True" in the Photometry screen
if not checked : only the stars that have "ok = True" in the Photometry screen will be shown
- Use Stacked Stars : the stacking done in the Photometry screen will be shown.
- Nbr of files present : total number of photo's in the selected folder
- Arrows : show previous or next photo in the folder
- the field between the arrows : to show the x-th photo in the folder
- Refresh Screen : refresh the screen for the new values
- FWHM : the factor with which to multiply the width (FWHM) of the star to obtain the radius of the Aperture used to calculate the flux (intensity) of the star.
- Background MAD field : if not using the annulus to determine the background level, the background is determined in a slightly different way. The effect is shown in the second figure for each star.
1. first we calculate the MAD = median (abs (pixel value - median (image)))
2. background image = all pixels lower than the mean of the (remaining image + MAD-factor (from the screen) * MAD)
3. loop three times over 1. and 2.
4. remove pixels lower than ADU = 1
5. sigma clip all pixels farther than 2 sigma away from the mean value of the remaining image
6. background level = the mean of the remaining pixels
- Aperture MAD : experimental field. Will probably be removed from a future version of Astropy
- Name of the file shown at this moment

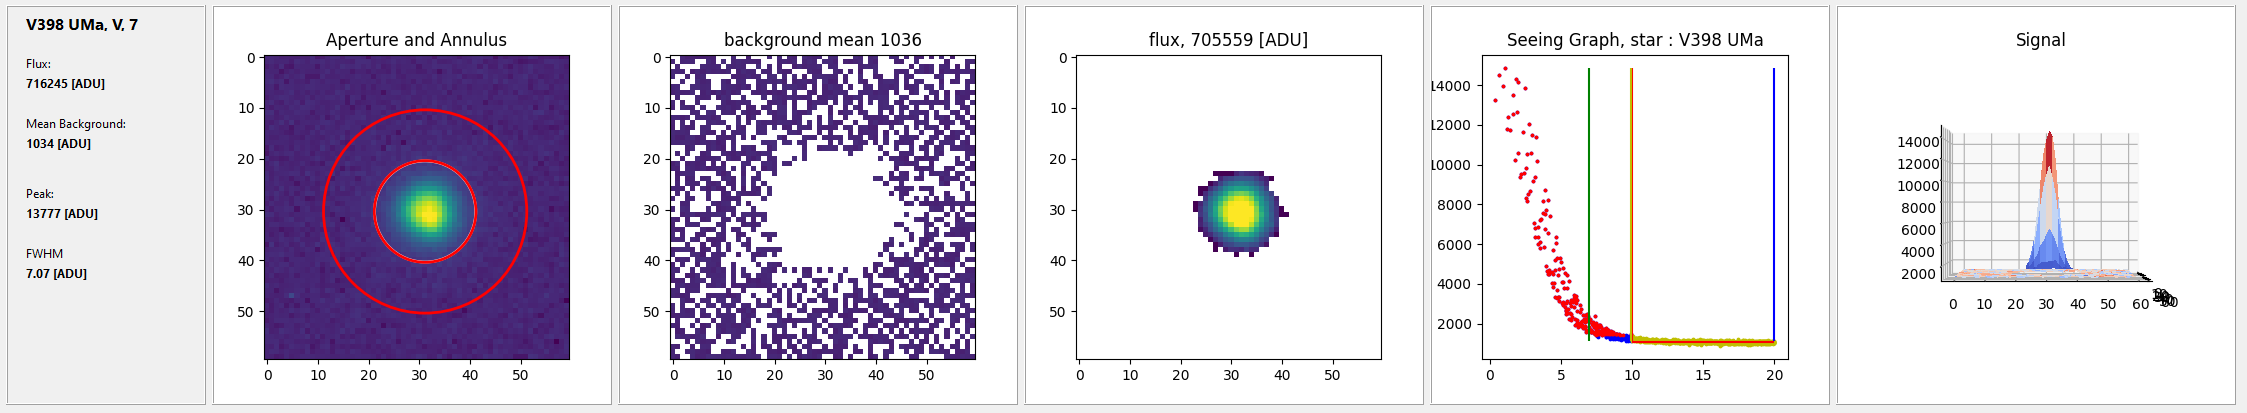
What is shown for each star ?
- Flux : the total flux of the star through the aperture, in ADU
- Mean Background : the background, in ADU
- Peak : the ADU of the brightest pixel in the star
- FWHM : the width of the star in pixels (full width half max).
The Figures
- The star with the aperture and the annulus. As defined in the Star Group.
- The background as calculated with the field Background MAD. The selected fields for the calculation are the colored ones in this figure.
Basically the mean of the background, excluding the points more than 2 sigma away from the median, and by exclusion of points with value zero. Gives slightly better results than the annulus, as there are more points and thus a better statistic
- A cutout of the star. Should have given better results for the flux, but until now experiments are not promising. So, just shown for fun.
- Seeing Graph : x-axis = distance from center, y-axis : the value of the pixel in ADU
green line : the radius of the aperture, as defined in the star group
light green line : FWHM times the FWHM Factor times two (as it is used as radius and not as diameter)
red line : inner radius of the annulus
blue line : outer radius of the annulus
red dots : the signal
light green dots : the background pixels
- The Signal : 3D graph of the used background and the star.
 ;
;