Photometry
This screen is the most complicated of AstroPie. But it is also the most interesting one !
It presents the result of the photometry, but also gives you lots of manipulation possibilities. Extract of the results for use elsewhere can be done too.
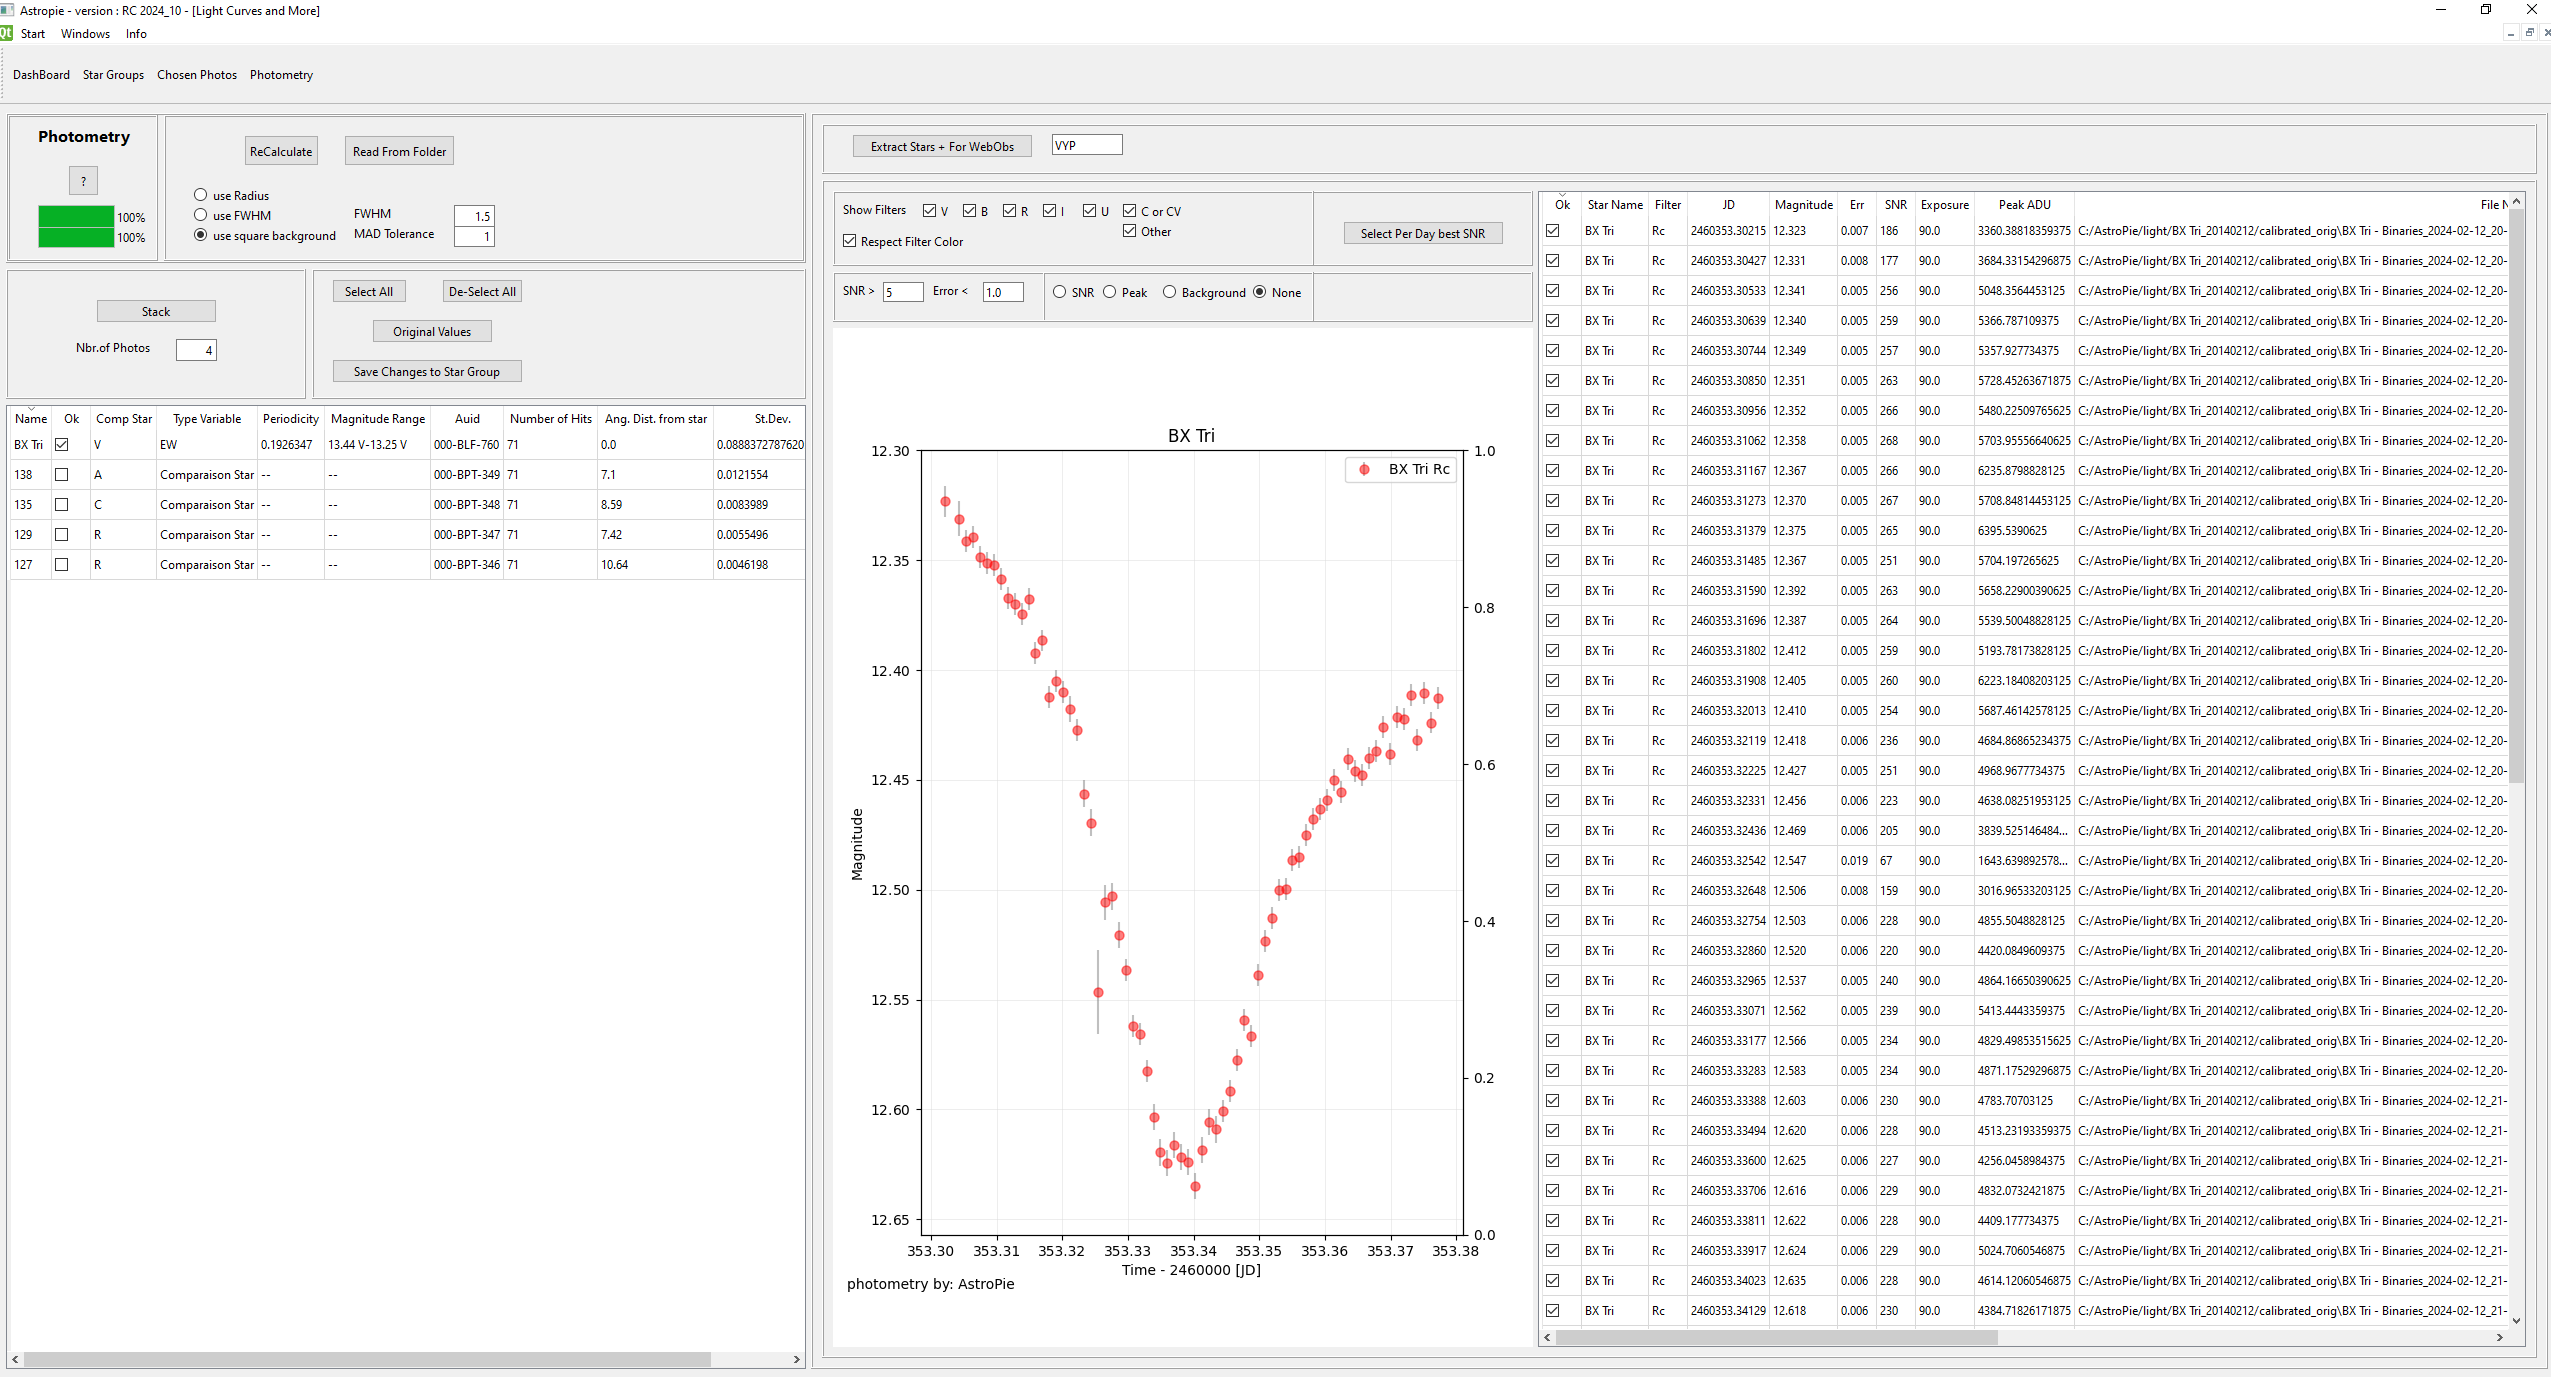
What are the different parts of the screen ?
- The list of stars in the Star Group
- A figure of the selected stars in the Star Group
- The photometry data for the selected stars
- Calculate again with slightly different parameters
- Extract
IMPORTANT REMARK :
- Between the list of stars and the figure there is a splitter : you can make the figure or the table larger or smaller
- Same between the figure and the photometry data block.
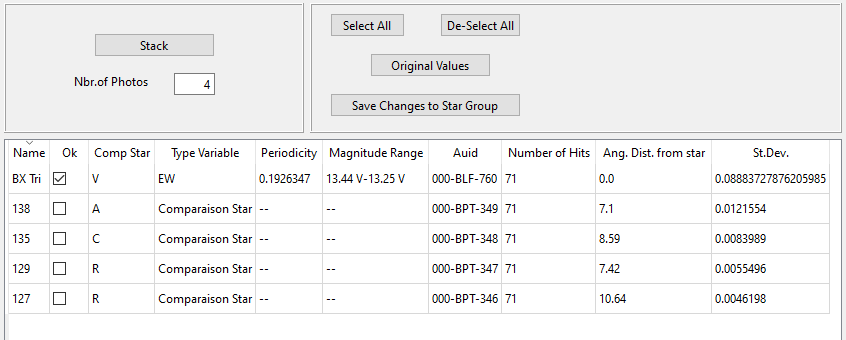
List of Stars in the Star Group
The list itself.
- Name of the star
- OK : if this field is checked the graph of the photometry of the star will be shown, the data will be shown in the data-block, and in case of an extract, a file with the data will be generated
- Comp Star : V for Variable, R for Reference Star, C for Check Star, all other letters and numbers : as you wish.
Most important is the Reference Star, as the magnitude of that star is used to calculate all other magnitudes
C is necessary in case of an extract for AAVSO
If you change the field from R to something else, or vice-versa, and use the button "Recalculate" the photometry will be recalculated for the new set of reference stars.
- Type Variable, Periodicity, Magnitude Range
- AUID : if this field has a code, the AAVSO accepts photometry on this star.
- Number of Hits : number of photo's in the time series that this star has a valid photometry.
Important : all reference stars should have the same number of hits, otherwise there could be jumps in the photometry. Especially important if you analyse ExoPlanets, as in that case we are interested in the relative flux.
- Ang. Distance from star : how far away in minutes is that star from the main star in the Star Group
- St. Dev. : standard deviation of the magnitude of this star in the time series. For a comparison star this should be as low as possible. If too high, change the field "Comp Star" from R(eference) to something else
The buttons
- Select all : change the ok-field to "checked" for all stars. The graph and data with the results will be adapted
- De-select all : change the ok-field to "unckecked" for all stars, EXCEPT for the main star of the star group
- Original Values : you can manipulate all shown fields of the star group. If you mess up, and have not saved it yet, you can return to the original values of the Star Group
- Save changes to the Star Group : save your changes in the Star Group for later use (adapts the file in the Coordinates folder)
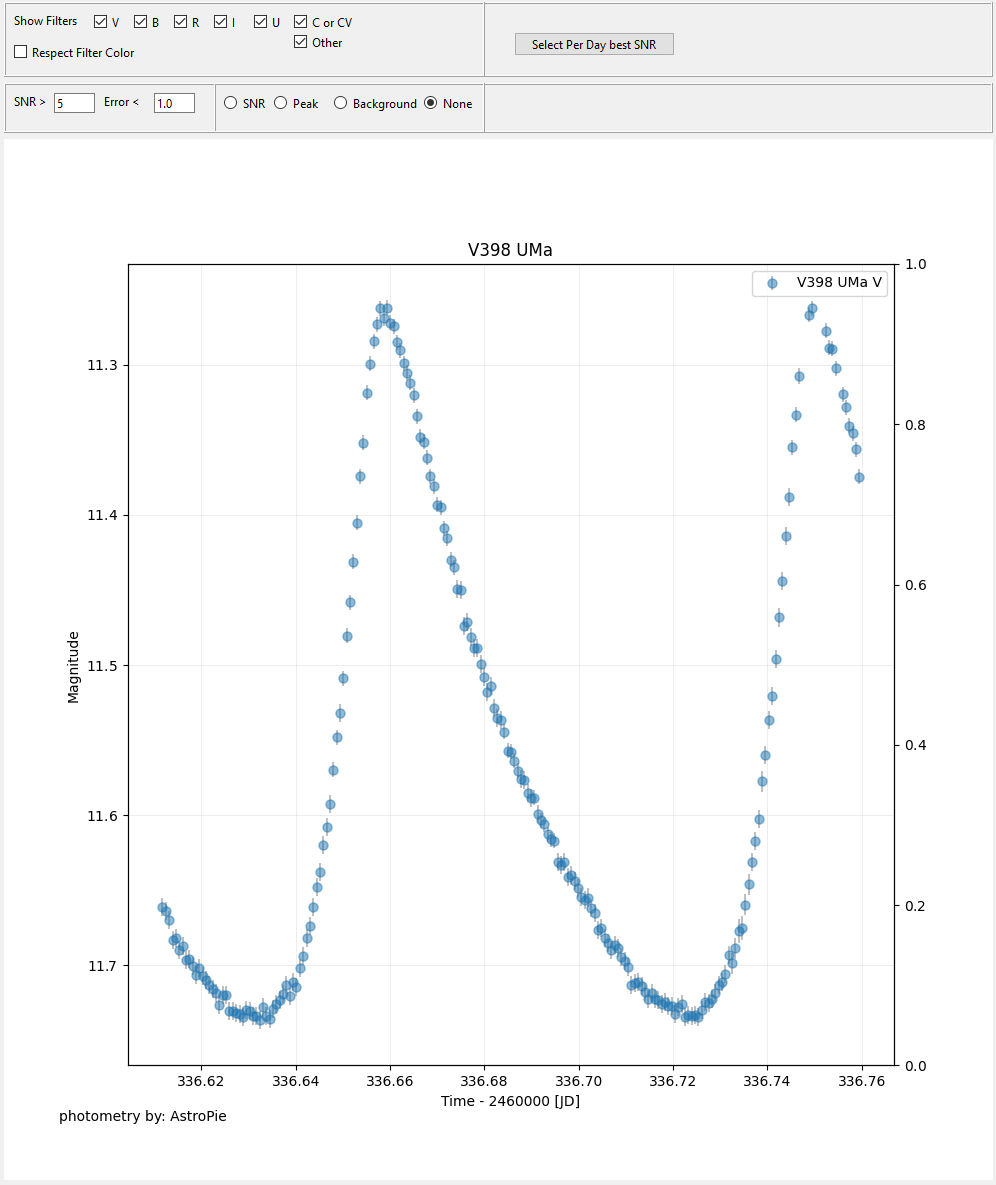
The Figure, and how to manipulate it
The stars shown are those that are selected via the "OK" field in the Star List.
- Show Filters : if more than one filter is in the time series you can activate or deactivate them
- Respect Filter Color : if more than one star is shown it can be interesting to uncheck this box to have a less subtle color difference between the graphs on the figure.
- SNR and Error : eliminate cases with a SNR smaller than the given value, or an Error higher than that value
- SNR, Peak, Background, None : show additionally these values in the Figure too.
- Button : Select Per Dag best SNR : sometimes one takes several photo's of the same star, with different exposure times. For Example with SS Cyg one never knows what the magnitude will be. This button selects the line with the highest SNR. The table with the data will be adapted too.
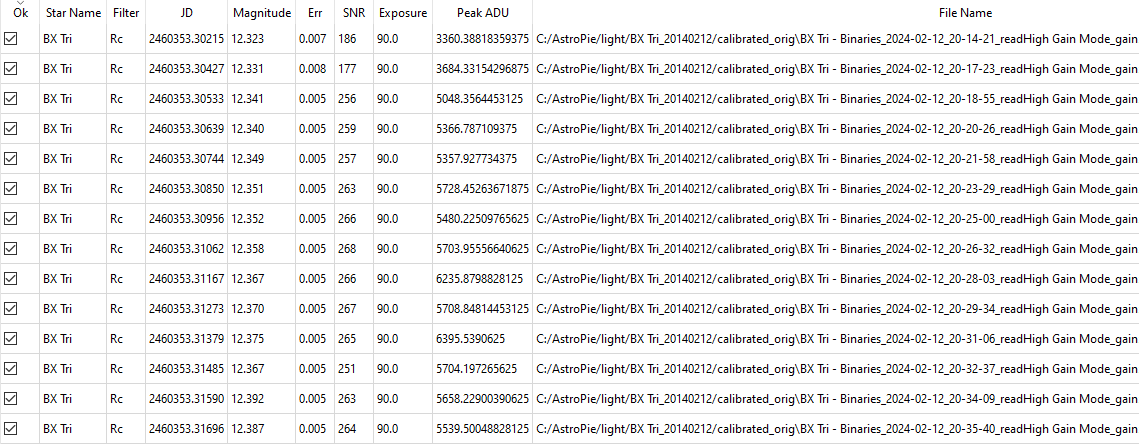
The Data
This table lists all photometry done in the time series, if the star is selected in the Star List.
Some lines are unchecked due to the filters on the Figure tab
If you want to remove a point from the figure, uncheck the ok field. That measurement will not be in the extract file.
Changing the Photometry rules.
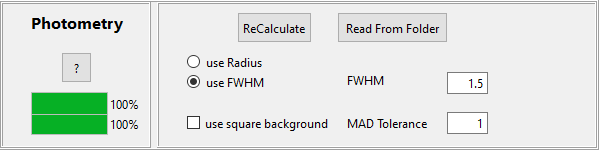
- button "ReCalculate" : start the photometry again with the (changed?) parameters on the screen. After a change of the Reference Stars, after a change of the radio boxes in this part of the screen, the photometry can be calculated again.
Important : the photo's are not read again, the photometry is done on the list of photo's as they were when they were originally read.
- button "Read From Folder" : this is the same as the button "ReCalculate", BUT : the selected folder in the dashboard with the photo's is read again. THUS : if you removed photo's, or added new photo's (e.g. during a photometry session on a clear night), they will be in (or out) the new photometry.
- use Radius : in the Star Group definition a radius (in pixels) of the aperture that is placed above the star is given. When this radio button is selected, the flux passing through this circle is used for the calculations.
- use FWHM (recommended, in most of the cases) : instead of using the radius , the program uses the width of the star on the photo to determine the radius of the aperture. This is much more flexible than the previous option and should (almost) always be used.
The field FWHM, with default value 1.5, is the multiplication of the calculated width (FWHM - Full Width Half Max). Sometimes a bit smaller or a bit higher value can be interesting.
--> Important remark about FWHM : for low magnitudes, or low SNR, it has been shown that the calculation of FWHM by the AstroPy routines is not very accurate. In that case it is better to use the Radius technique for the size of the aperture.
Personnaly I always try to have a SNR of about 300 or more, but some people prefer to work with SNR of 30. Which can give inaccuracies.
- use square background : this is a new development to determine the background around the star. The algorithm behing it is proving to be more reliable than the annulus.
Not Checked : the program uses the radius-in and radius-out (as defined in the Star Group) to determine an annulus around the star. The sigma-clipped "2" in that region is the mean value
Checked : instead of the background, we use all the pixels that are in the cell (see cellsize parameter in the astropie.ini file). This gives in almost all cases a slightly better statistic.
Except :
- the pixels that are zero
- the pixels that are higher than "mean + MAD value".
Extract
To extract the results of your photometry.
The usercode is the usercode for AAVSO.
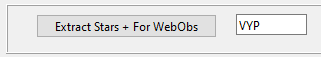
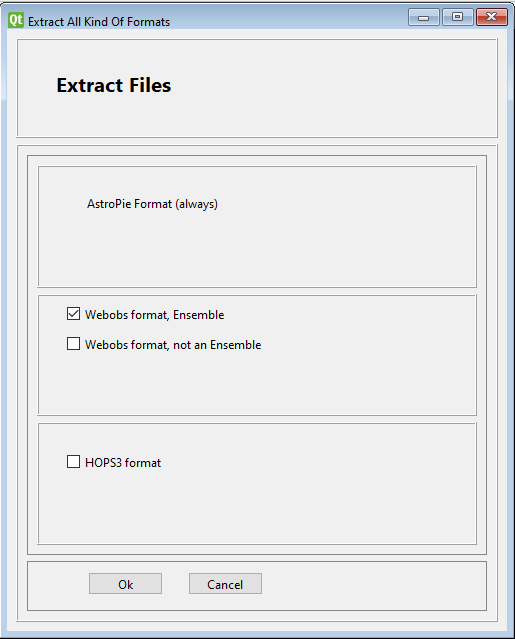
The button opens another dialog :
For AAVSO, choose between :
- Webobs format, Ensemble
- Webobs format, not an Ensemble
For Exoclock.space (exoplanets à gogo) :
check the box HOPS3 format
But where will these files be placed ???
First of all, all files will be added to the directory with the analysed photo's.
But, also in :
In your AstroPie.ini file there is a line like this :
photometryFolder=C:\\Users\\piete\Dropbox\AstroPie\Out_Files
That is the base folder.
The files will be placed in subfolders of this base folder :
The AAVSO file will be placed in the two subfolders ./webobs, and ./< star name >
The HOPS3 (exoclock.space) file will be placed in the subfolder ./< star name >
for BX Tro the subfolder would thus be :
C:\\Users\\piete\Dropbox\AstroPie\Out_Files\BX Tri
and :
C:\\Users\\piete\Dropbox\AstroPie\Out_Files\webobs